Traffic
See sessions, channels, landing pages and key events from Google Analytics, next to your search data.
The Traffic screen shows what visitors do on your site. The numbers come from your Google Analytics (GA4) property. Search performance tells you how people find you in Google. Traffic tells you where all your visitors come from and whether they do what you want.
Open it from the Traffic card on the SEO home screen.
Before you start: connect and sync
Connect Google Analytics
If Analytics is not connected, the screen shows Google Analytics is not connected. Click Connect Google Analytics. Google's sign-in opens in a new browser tab. Sign in with a Google account that can read this site's property. The box updates on its own when you come back. See Connect Google.
Pick the property
Analytics does not say which website a property measures, so Meelu asks Which Analytics property measures this site? Pick the right one from the list. Nothing syncs until you do. Picking a property starts the first sync.
Import your history
The first sync imports 16 months. If it did not start, click Import 16 months. The sync runs on Meelu's server, so you can close the tab while it works. A progress bar shows Importing traffic data — day X of Y and the number of rows stored. Click Stop sync if you need to.
Keep it up to date
Meelu syncs every connected site with a chosen property once a day on its own. Click Sync now to bring in the newest days at once. Meelu keeps every day it has synced, so your history grows beyond the first 16 months.
Syncing is free
Syncing does not use credits.
Reading the screen
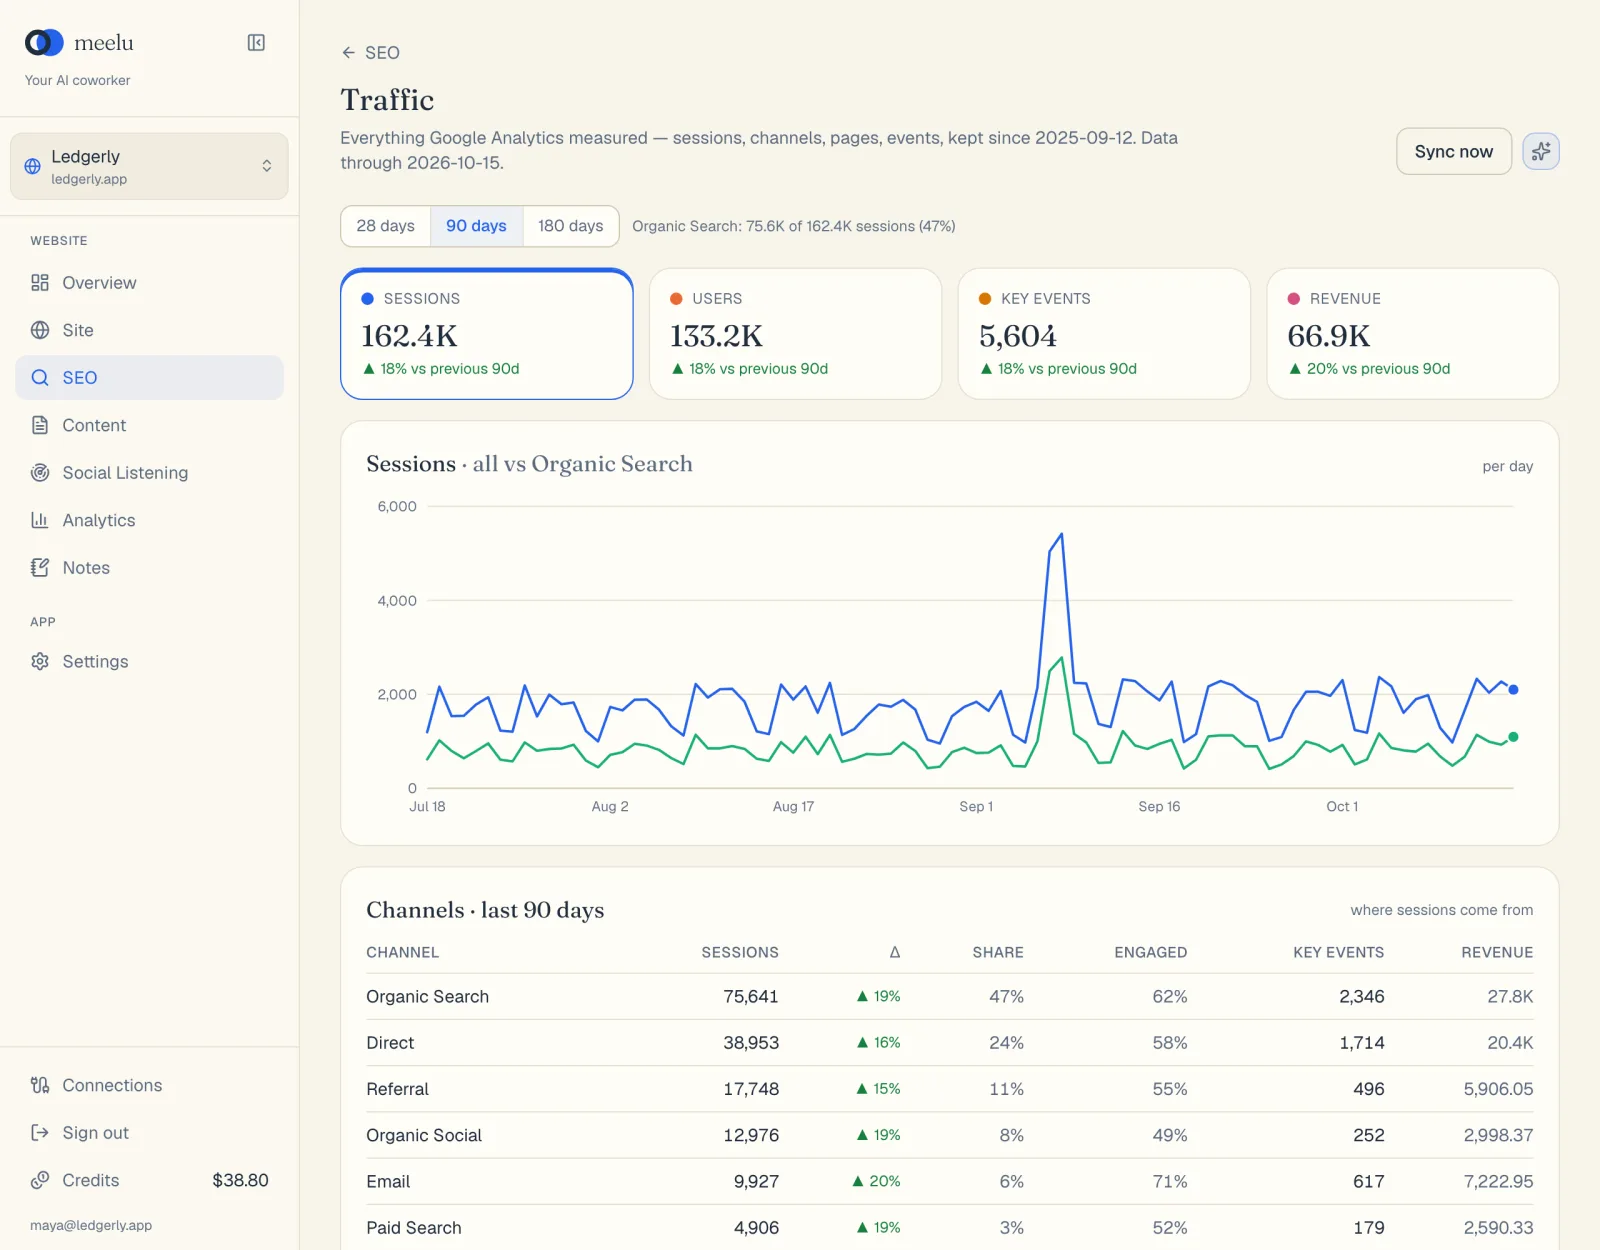
- 1Sync now fetches the latest Analytics data
- 2Pick the time range
Time range
Choose 28 days, 90 days or 180 days. Next to it, a line shows how many sessions came from Organic Search, which means unpaid Google and other search engine results.
Metric tiles
| Tile | Meaning |
|---|---|
| Sessions | Visits to your site. One person can make several sessions. |
| Users | Distinct visitors. |
| Key events | The actions you marked as important in Analytics, such as a sign-up or a purchase. Google used to call these conversions. |
| Revenue | Money recorded by Analytics, if your site sends it. |
Each tile shows the change against the previous range. Click a tile to show it in the chart. When Sessions is chosen, the chart shows two lines: all sessions and Organic Search sessions.
Channels
Channels · last N days shows where sessions come from, such as Organic Search, Direct, Referral or Paid Search.
| Column | Meaning |
|---|---|
| Channel | The traffic source group. |
| Sessions | Visits from this channel. |
| Δ | Change against the previous range. |
| Share | This channel's part of all sessions. |
| Engaged | The share of sessions where the visitor really engaged, as Analytics defines it. |
| Key events | Important actions from this channel. |
| Revenue | Revenue from this channel. |
Landing pages
Landing pages · last N days lists the first page of each visit. Use All channels to show only one channel, for example only Organic Search. Type in Filter pages… to find a page. Click Sessions, Δ, Key events or Revenue to sort.
This is where you find pages that get traffic but no key events, and pages that convert well but get few visits.
Pages viewed
Pages viewed · last N days lists every page people looked at, not only the first one. Columns are Views, Δ, Users, Avg. time (average engaged time per user) and Key events.
Breakdown
Breakdown · last N days splits your traffic in other ways. Pick a tab:
| Tab | Shows |
|---|---|
| Sources | Each source and medium, such as google / organic. |
| Events | Each event Analytics recorded, with its count. |
| Countries | Where visitors are. |
| Devices | Desktop, mobile or tablet. |
| Systems | Operating systems. |
| Browsers | Browsers. |
A note at the bottom names the Analytics property in use. Click change in it to pick another property.
What each button does
| Button | What it does |
|---|---|
| Connect Google Analytics | Opens Google's sign-in in a new tab to connect your Google account. |
| A property in Which Analytics property measures this site? | Saves that property and starts a sync. |
| Import 16 months | Runs the first sync. Shown when there is no data yet. |
| Sync now | Brings in the newest days. Meelu also does this once a day on its own. |
| Stop sync | Stops a running sync. Days already imported are kept. |
| change (in the note at the bottom) | Shows the property list again so you can switch. |
| 28 days / 90 days / 180 days | Sets the time range for the whole screen. |
| Metric tiles | Choose what the chart shows. |
| All channels menu | Filters Landing pages to one channel. |
| Filter pages… | Finds pages by address. |
| Column names | Sort the table. |
| Breakdown tabs | Switch the breakdown table. |
| ‹ Prev / Next › | Page through a table. |
| Ask Meelu (sparkle icon) | Opens a task about your traffic. |
Questions to ask Meelu here
The Ask Meelu button on this screen offers four prompts:
- Where does my traffic come from? Which channels and sources carry the site, and how the mix moved.
- What actually converts? Which landing pages and channels produce key events, not just visits.
- What changed and why? The biggest movements, and whether each is a real shift or a one-day spike.
- Is organic pulling its weight? The share Organic Search carries, how engaged those visitors are, and whether it is growing.
See Asking the SEO desk.